DHI data fills the gaps, giving you a complete picture of each cow’s performance. With high-risk stakes during transition, accurate, precise data to make good management decisions is crucial. Although, many herd-wide decisions such as ration changes may be made based off bulk-tank averages, there is no better source of data to make individual or group decisions than DHI data. Here are a few key metrics, measured by DHI, that can provide valuable insights about groups or individual cows, during early lactation, that lead to more profit.
Dry-cow treatment efficacy
Under pressure from public perception and costs, many dairies have explored selective dry-cow-treatment programs. The basis of these programs is differentiating low-risk cows from high-risk, and only treating those that are high-risk. For these programs to be effective, additional cows need to be identified through somatic cell count (SCC) data, not just those who’ve had clinical mastitis. Additionally, whether it be selective- or traditional- dry-cow treatment protocols, it’s important to evaluate the effectiveness of the program with dry-cow cure rates and dry-cow new-infection rates. First- and last-test somatic cell scores (SCS) are necessary to calculate these numbers. If you’re not monitoring and addressing the success and failures of dry-cow programs, you’re missing an opportunity to reduce costly mastitis cases, increase production, and improve milk quality.
Metabolic disease insights
One of the greatest challenges that can plague high-production herds is ketosis. Ketosis can impact high-production cows to the tune of 300-400 pounds of milk per lactation. Of course, we’re all very familiar with various forms of keto strips used to diagnose clinical ketosis. However, what is harder to determine is if your herd has a subclinical problem. With DHI, subclinical ketosis can be monitored using first-test fat-to-protein ratios (F:P). Herds should strive for less than 40% of fresh cows with a first test F:P ratio of 1.4. While the herd average may seem within range, a closer look often reveals that certain groups, such as a specific lactation group, may have higher rates of issues that aren’t detectable through traditional ketosis diagnosis.
Peak milk performance
For each one-pound change in peak milk, you can expect a change of 200-250 pounds of total milk yield for the lactation. With such a strong correlation to total milk yield, it’s essential to monitor and manage peak milk weights collected by DHI sampling. With the simple graph displayed here, there are several important assumptions and insights we can draw.
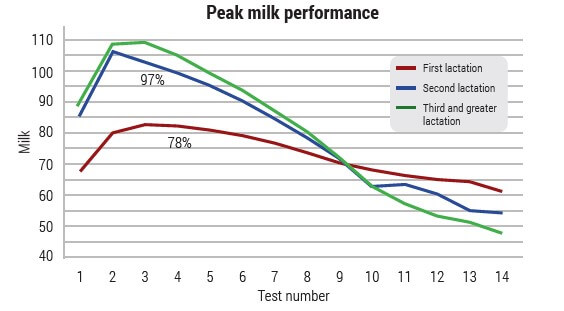
- Peak milk ratios: First lactation peak milk ratios can be a strong indicator of whether the “sweet spot” has been found for an age at first calving
- Lactation persistence: How quickly or slowly do cows drop in production following peak performance? Are they running out of energy earlier in lactation than desired?
- Sophomore slump: Are second lactation cows underperforming expectations or showing less persistency than mature cows. This could be an indicator of inadequate body conditioning at the start of the lactation.
With ever-tightening margins, every day of a cow’s life counts, especially high-value, early-lactation days. The transition period is both the highest risk and highest reward period of a cow’s life. This make-or-break time will set the tone for the entire lactation and may even dictate whether it will be her last. Don’t leave management decisions to chance due to lack of necessary information. With DHI data, you gain a complete picture of each animal’s performance, enabling more-informed decisions that can enhance profitability.
Author: Cole Mark, CentralStar Director of Consulting and Profit Strategies