Reproductive efficiency is a key component of profitability. A well-managed program increases milk production by extending lactations and maximizing genetic gain. It also supports timely culling, maintains herd-size consistency, and ensures a steady supply of replacements. The DHI Herd Summary-202 report gives a snapshot of your dairy’s current reproductive status and points to areas of improvement. Next we’ll walk through a few key areas of the report that are important to monitor, along with why these numbers matter to decision-making and long-term herd goals.
Voluntary waiting period (VWP), calving interval
Monitoring VWP is crucial to ensure a successful reproduction program. Depending on the reproductive protocols being followed, there can sometimes be a mismatch between the first service you believe you are achieving and what shows up on the herd-summary report. Monitoring VWP by lactation group will help you determine how compliant your team is at following protocols.
In Table 1, this dairy’s VWP is 70 days, but the first-lactation group averages 87 days, while the second-lactation group is right at 70. Seeing this information should cause you to question what’s happening differently with the first-lactation group. Are there transition issues, heats being missed, overcrowding, etc.? All these factors contribute to why the first-lactation animals are being bred later than what your protocol states.
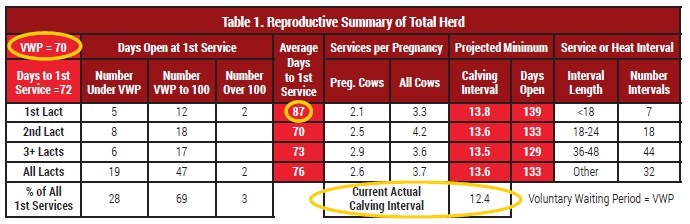
The current actual-calving interval is the average amount of time it takes animals to calve after the end of their last lactation. Ideally, this interval should be 12 – 13 months to ensure a consistent flow of lactations. When the calving interval increases, so do your herd’s days open. One day open beyond the VWP can cost nearly $3 per day. If your dairy’s calving interval is slowly increasing, looking into your reproductive efficiency will help lower days open.
Heat detection
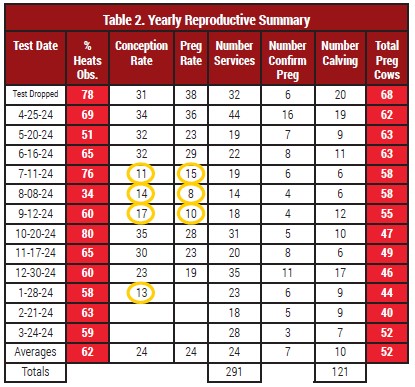
In Table 2, the yearly reproductive summary provides a quick look at heat detection, conception rate, and pregnancy rate over time. Looking at your averages gives you a good benchmark for your herd. Conception rate is the percent of breedings that result in a pregnancy. Pregnancy rate is the percentage of cows that get bred and give birth. Along with looking at the averages, look for outliers in the months. Think back to what may have happened in those lower-conception months; were there feed changes, employee turnover, etc.? If the reason is preventable, you can implement changes to avoid the swings in conception and pregnancy rates.
Dry cow profile
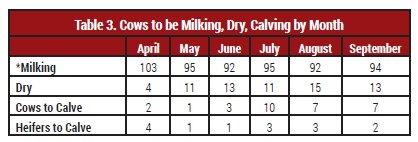
Monitoring how many cows are milking, dry, and calving by month (Table 3) is important to keep numbers as steady as possible throughout the year for constant milk production. It is ideal to have 80-83% of your herd in milk throughout the year. Monitoring this throughout the year will help reduce slug calvings, which in return reduces slug breedings.
Reproduction plays a critical role in overall herd performance, since delayed breeding quietly erases profits from your bottom line. DHI data helps fill in the gaps, giving you a clearer picture of each cow’s performance and where issues may be hiding. Tracking key metrics and sharing the DHI Herd Summary report with advisors (veterinarian, nutritionist, CentralStar team) will help you spot problems early and take timely action. With a clearer picture, you can make better decisions and achieve greater results.
Author: Laura Styczynski, CentralStar Records Analysis Consultant